
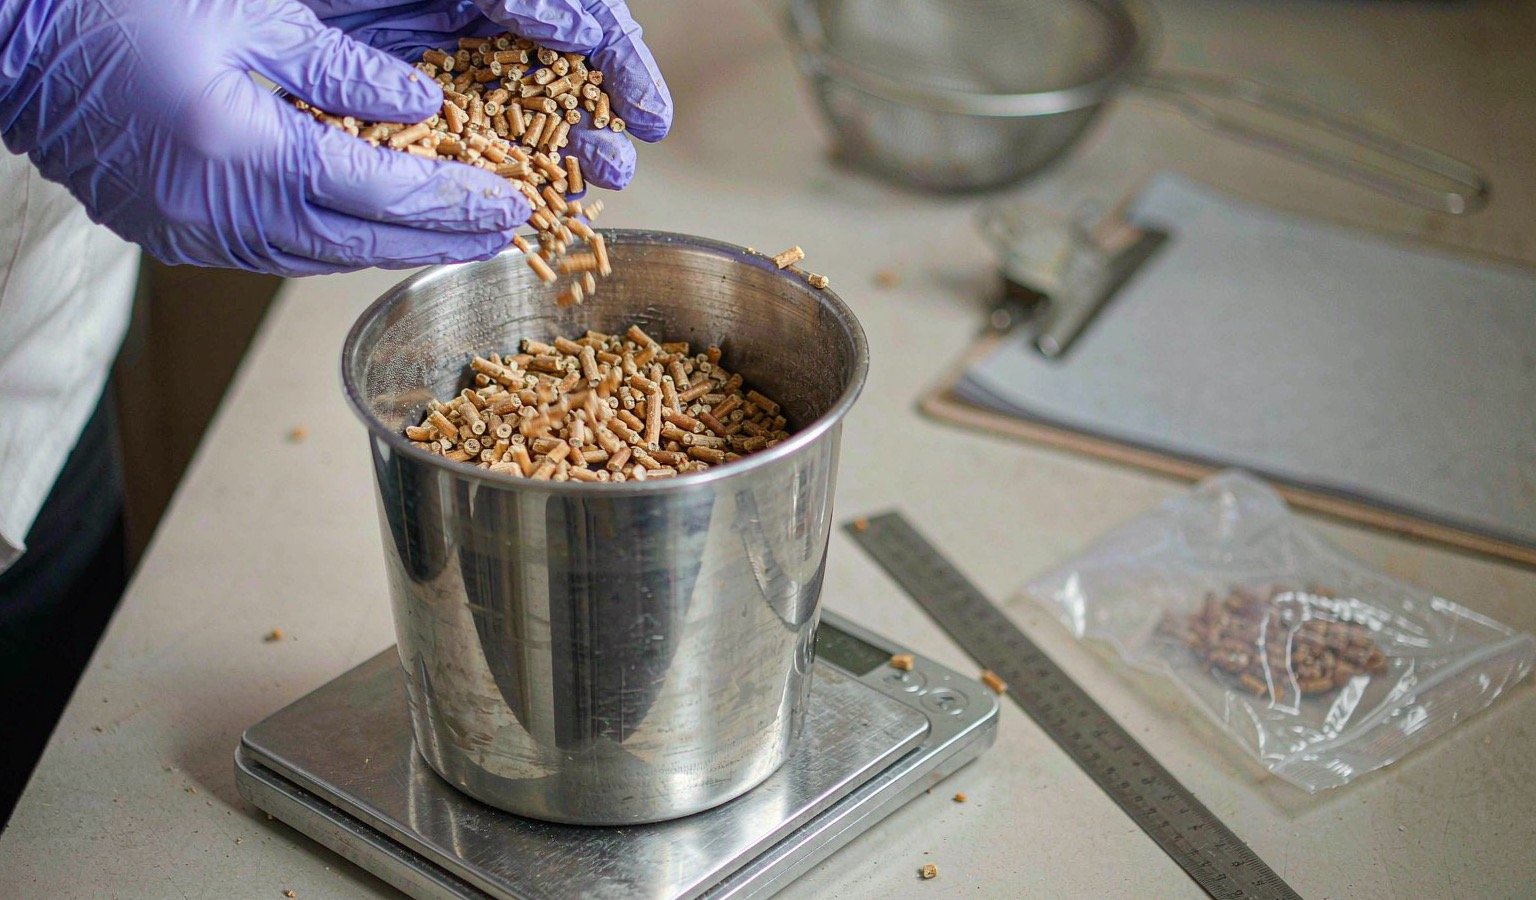
Bulk density is the quiet number on your spec sheet. It sits in a band on every quotation — 600–750 kg/m³ for ENplus A1 wood pellets — and most producers never think about it until a buyer asks why a ship held 12,000 t instead of 15,000 t, or why their silo holds less than the drawing promised. The band is wide on purpose, and where your product lands inside it changes real money: hold capacity, silo sizing, truck loads and, indirectly, how the buyer judges your pellet quality.
This article explains what the number measures, how the standard measures it, what moves it up or down on a working line, and where it converts into freight and storage arithmetic.
What the standards say
Bulk density is the mass of pellets that fills a unit volume, voids included. It is not particle density: the pellets themselves are far denser — the IMSBC Code schedule for wood pellets describes typical specific density between 1,100 and 1,700 kg/m³ (Resolution MSC.393(95), the amendment that inserted the WOOD PELLETS schedules — reproduced in the Finnish transport authority’s copy). Bulk density counts all the air between cylinders, which is why it responds to grind size, pellet dimensions and fines in ways particle density never does.
| Where the number appears | Value | Notes |
|---|---|---|
| ENplus A1 (Handbook v3.0, Part 3) | 600–750 kg/m³ | Applies to certified wood pellet trade; see the ENplus handbook PDF |
| ISO 17225-2, Table 1 (wood pellets) | 600–750 kg/m³ | Reproduced in Ontario’s emissions guideline for wood-fired combustors (Ontario guideline PDF) |
| IMSBC WOOD PELLETS schedule | 600–750 kg/m³ bulk density; stowage factor 1.33–1.67 m³/t | The carriage basis for bulk sea transport |
Note the relationship in the last row: the stowage factor band is just the arithmetic inverse of the density band. One divided by 0.75 t/m³ is 1.33 m³/t; one divided by 0.60 t/m³ is 1.67 m³/t. Everything downstream — vessel intake, silo tonnage, truck loads — falls out of that one ratio.
How it is measured, and why the number moves
The reference method is ISO 17828. In the standard procedure for pellets, the sample is poured into a small 5 litre container (about 164 mm internal diameter) from a height of roughly 200–300 mm to form a cone, the filled container is dropped three times from about 150 mm onto a wooden board, the surface is struck off level, and the net mass is weighed; a 50 litre container serves coarser biofuels. The drop sequence compacts the bed — the standard’s own revision notes record volume reductions of roughly 6–18% from the compaction steps — so the published value reflects a handled, settled product rather than a freshly poured pile.
Two implications follow. First, the number is comparable between sellers and buyers only because the method is fixed; if your lab pours gently and skips the drops, your 680 kg/m³ is the buyer’s 620. Second, bulk density is not an absolute property of the pellet — vibration during transport settles beds further — so contracts should always name the method, not just the band.
The method also expects at least two parallel determinations on each sample, averaged, with the container calibrated by water filling — a cheap discipline that removes most lab-to-lab argument before it starts. For a plant without a laboratory, the whole setup is a 5 litre steel container, a bench scale and a straight edge; there is no reason to trade on a number you cannot reproduce in ten minutes.
What pushes your bulk density up or down
On a working line, four variables do most of the moving:
| Driver | Direction of effect | What to check |
|---|---|---|
| Die compression ratio | Higher L/D compresses harder and packs denser pellets | Compare your die’s L/D against the 4–5 range typical for wood (APEC pelletisation data); see our compression ratio guide |
| Die and roller wear | Worn holes and an open roller gap lower compression, producing lighter, crumblier pellets | Inspect hole shape and inlet wear; see our ring die buying guide |
| Grind particle size | Finer particles pack tighter and bind better; coarse slivers leave voids | Check hammer mill screen condition and oversize carryover |
| Fines content | Broken material fills voids and can raise the apparent bulk density while damaging quality | Do not chase the density number by adding fines — buyers sieve it out and re-test |
That last row deserves emphasis. Because fines occupy the spaces between sound pellets, a dusty product can post a flattering bulk density while failing the fines limit at delivery — the freight analysis of pellet cargoes on HandyBulk makes the same point about stowage: fines fill void spaces and alter the apparent stowage factor, but high fines content reduces cargo value. Measure density and fines together, always.
Why the number moves money
Vessel intake
Wood pellets are a volume cargo: a ship filling with pellets usually reaches its hold cube long before its deadweight. The stowage factor translates your density into tonnage. For a 20,000 m³ hold — Handysize territory — the arithmetic looks like this:
| Bulk density achieved | Stowage factor (arithmetic) | Tonnage in a 20,000 m³ hold |
|---|---|---|
| 750 kg/m³ | 1.33 m³/t | ≈15,000 t |
| 650 kg/m³ | 1.54 m³/t | ≈13,000 t |
| 600 kg/m³ | 1.67 m³/t | ≈12,000 t |
That is a 25% swing in cargo per voyage between the top and bottom of the band — on the same ship, burning the same fuel. Published trade references put typical pellet stowage factors around 1.35–1.60 m³/t (MetaCAD’s cargo data page), which brackets the arithmetic nicely. If your mill consistently lands at the bottom of the density band, your customers are paying sea freight on air, and they will eventually do that arithmetic too.
Silo and warehouse sizing
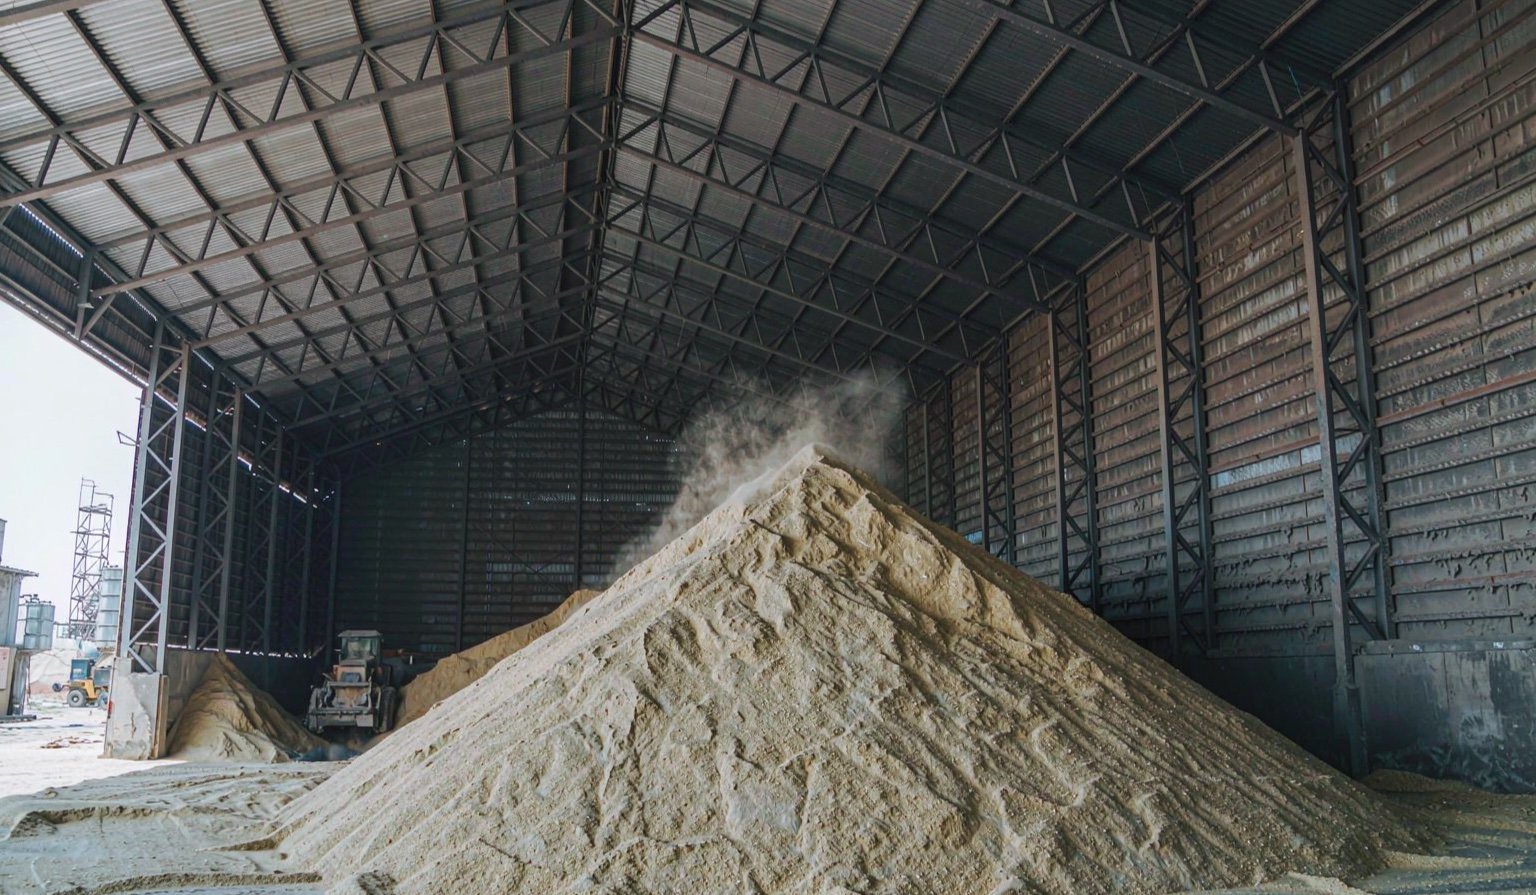
The same ratio runs the other way onshore. A 100 m³ silo holds about 75 t of 750 kg/m³ pellets and only about 60 t of 600 kg/m³ pellets (arithmetic). Plants that sized their buffer silos for the top of the band discover the shortfall during their first heavy production week — which is why our storage and silo guide treats density as a design input, not an afterthought.
Boiler feeding
Industrial boilers dose fuel volumetrically: each revolution of a feed screw delivers volume, not mass. A cargo whose density swings from 620 to 740 kg/m³ across deliveries changes the energy per feed stroke by nearly 20% (arithmetic on the same band), which stoker operators notice as unstable heat output before anyone mentions density. Consistent density is a fuel-stability feature, not a cosmetic spec.
Trucks and bagging
Onshore transport repeats the pattern at small scale. A walking-floor trailer with a 40 m³ box carries roughly 26 t of pellets at 650 kg/m³ (arithmetic) — subject, always, to the road weight limits of the route, which in many countries bind before the box fills. In bagging, density decides how many 15 or 25 kg bags a pallet carries at a given stack height and how many pallets a container absorbs; a mill selling retail bags into the ENplus bagged market feels every kilogram per cubic metre in film, pallets and container space.
What buyers read into a low number
Bulk density has a second life as a quality proxy, and it is worth knowing how buyers use it. A cargo posted at the bottom of the band, with a durability number to match, tells an experienced trader a familiar story: light compression at the die, or a die running past its wear limit, or a grind that left coarse slivers in the feed. None of those stories is necessarily true — but the combination invites the question, and questions delay orders. The defence is documentation: publish density alongside durability and fines from the same retained samples, and the numbers corroborate each other. Our guide to the in-house durability test pairs naturally with the density procedure described above, since one bench can run both.
The reverse also holds. A mill that can show 690–720 kg/m³ with durability above 98% has documented, in two numbers, that its compression zone is healthy — which is exactly what a buyer paying a premium for certified product wants to see before the first vessel is fixed.
A ten-minute density audit for your line
Run this once a month, and whenever the die or the feedstock changes:
- Take a fresh sample from the cooler discharge, not from a bag that has already been handled.
- Fill the 5 litre container from about wrist height, cone the top, and drop the filled container three times from roughly 150 mm onto a wooden board, per the ISO 17828 procedure.
- Strike off level, weigh net, divide by volume, and run it twice — record both numbers.
- Compare against last month’s figure and against your contract band. A drop of more than a few percent between months is a die or grind question, not a coincidence.
- Sieve the same sample at 3.15 mm so density and fines are always logged together.
Testing practice and contract wording
Write the density requirement into contracts with three elements: the band (600–750 kg/m³ for A1), the method (ISO 17828, with the drop-compaction steps as standard), and the sampling point (loading, with sealed retained samples). If a discharge test disagrees with a loading test, the retained samples settle it — the same discipline we recommend for durability testing applies here.
If your own numbers sit low in the band, work the list in order: verify the die’s compression ratio and wear state first, because that is both the cheapest lever and the one most often neglected; then check grind quality at the hammer mill; then confirm your final moisture sits inside the drying window — Biomass Connect’s pelletisation guide places the workable moisture window for pelletising at roughly 10–15%, and drying outside that window drags density and durability down together.
One closing suggestion for sales teams: a mill that can document 680–720 kg/m³ on ISO 17828 method, with retained samples, has a genuine selling point against competitors quoting “600–750” and hoping. The band is wide; the sellers who control their position inside it are the ones buyers re-order from.